INTRODUCTIONRhinitis is an important public health issue, involving millions of people worldwide. Understanding it better is important to improve clinical practice. It is estimated that billons of dollars are yearly spent either on controlling this disease or wasted on productivity drop.
Methods such as acoustic rhinometry (ARNM) and nasal inspiratory Peak Flow (NPF) are used on clinical practice to evaluate functional and morphological alterations of nasal cavity towards rhinitis. These tests are useful for the diagnosis and monitoring of rhinits pharmacological and immunologic treatment.
ARNM is a method introduced by Hilberg et. al. who based their analysis on reflected sound waves in nasal cavity. Acoustic pulses go along nasal cavity, so the sound is reflected as the waves run into structures along the passage. The reflected waves are detected by a microphone and then amplified, filtered and digitalized, being converted into an area graph versus distance. This method still needs to be standardized (2, 3), but its use is frequent in the practice of the Rhinitis Group of ENT Ambulatory of HC-FMUSP (Clinical Hospital of São Paulo University), helping on objective evaluation of nasal function (4)
NPF is a simple technique which measures air flow in nasal cavity during quick and forced nose breathing. Breathing should be carried out having patient in standing position. The average of three breathings can lead to a more certain result. For many years, this technique has been used in Pneumology and more recently in Rhinology, having good clinical correlation between measures and symptoms referred by the patient (5).
Although both ARNM and NPF are accepted and used tests, there is no study which compares efficiency on clinical changing evaluations of nose obstruction and associated symptoms in patients with rhinitis. In despite of providing important information as obstruction reactivity at vasoconstrictors use, acoustic rhinometry (ARNM) presents significant limitations as bigger chance of measure error on narrow nose valves (6, 7) and absence of cut value which allows the use of the method in an objective way. Evidences show vast relation between NPF and clinical symptoms (5). This makes the importance of each of the methods less precise on clinical practice. Knowing these limitations would provide better understanding of the relative importance of each method on evaluation on patients with rhinitis.
The targets of this study are: 1. To compare the ARNM and NPF on the evaluation of nasal mucosa and cavity status; 2. To establish a relationship between these methods and rhinitis signs and symptoms.
MATERIAL AND METHODSThis is a pilot study on which 32 patients, aging over 16 years, from "Nasal Obstruction Prevention" League of ENT Division Ambulatory of HCFMUSP, were selected. They had symptoms followed by chronic rhinitis diagnosis.
The inclusion criteria of patients with chronic rhinitis was the presence of, at least, two of the following symptoms for more than four days a week, over four weeks: serious nasal mucosa, sneezes and/or nose obstruction. Sex, ethnic origin, social group, previous rhinitis doença de base or used medication during that time did not count on the choice of the patients.
Each patient had their nasal cavity evaluated by ARNM (Ecco Vision Acoustic Diagnostic Imaging - Eprex-Hood Laboratories) and NPF (Clement Clarcke International - model CE0120) methods.
Protocol was set as follows:
1. It was done a comprehensive ENT exam and a questionnaire was filled up to describe the common symptom degree of the patient, symptom in the evaluation moment, changing on septum of the nose (deviation presence, intensity and localization, presence of crests and/or spurs), changing on nasal mucosa (oedema, color) and changing on the patient palate and bite. Some of the evaluated examples are scored based on the same system used by Nasal Obstruction Prevention League, focusing on oedema sign and on congestion symptom. The score is:
Oedema:
0 - Absent.
1 - Hypertrophy of inferior or medium cornet and small nasal obstruction.
2 - Endangered breathing in one or both nasal cavities.
3 - Impossible breathing in one or both nasal cavities.
Congestion:
0 - Absent.
1 - Small and it does not disturb.
2 - Mouth breathing in most part of the day.
3 - There is no nose breathing; it interferes with sleep, smell or voice.
2. Each patient took a quick and forced nose breathing in standing position, using mouthpiece attachment to a measure device of nasal flow, blocking nasal cavity. It was measured with NPF (Picture 1). It was recorded three breathing values.
3. Measured with ARNM, it was applied a thin layer of gel in nasal adaptator is applied (with the purpose of better closing the joint between the adaptator and nostril). The patient sits with head leaned in vertical surface, not breathing during measurement. The adaptator gently touches patient in order to close his/her nostril and then the device reflects sound pulses for about ten seconds. The computer analyzes each pulse, what generates an area and distance graph, which is interpreted as exam result. The same procedure was repeated three times in each nostril. So, we obtained a more representative measurement of morphology reality of patient nasal cavity.
4. After recording measures, two instillations of topical vasoconstrictor (Naphazoline Hydrochloride 0,5mg/ml) were applied in each nostril. Fifteen minutes after application of vasoconstrictor, we repeated steps 1, 2 and 3.
Information was separately obtained for each of the two methods, and then it was made a comparative analysis together with clinical data.
This current study was analyzed and approved by Ethics Committee, HCFMUSP.
Statistical AnalysisBecause data are with no normal distribution, it was used non-parametric analysis methods, such as Kendall and correlation of Spearman. The results were similar in both tests. The analysis was done with SPSS 10 program (Statistical Package for the Social Sciences)
RESULTSAge of patients raged between 17 and 63 years, with average of 36.7. 17 (53.1%) out of 32 patients were female and 15 (46.9%) were male.
The obtained result comparison of oedema signs and congestion symptoms in each nostril before and after nasal vasoconstrictor use, showed expressive correlation in proportional and statistical way between both rates (p < 0.05), what generated a "clinical rate" (Table 1) obtained through value average of signs and symptoms of patient.
From this clinical rate, we created a score dispersion graph which enables to compare values obtained in each studied exam (NPF and ARNM) for each patient. Due to the similarities of the results between left and right nasal cavities, we chose to always display graphs with left cavity.
As NPF does not allow nostril analysis separately, we made use of clinical rate average between the two ones, comparing results before and after of vasoconstrictor use (Table 2).
In ARNM, computer measured data from the outside of nostril to five centimeters inwards. It was used standards as volume and minimum section area to be compared with clinical rate in each nostril, before and after vasoconstrictor use (Table 3). We have developed this case study observing correlation between clinical rate and volume and minimum section area in each nostril, measured only three and two centimeters from the outside of them (Table 4 and 5).
It was observed an expressive correlation, in proportional and statistical way (p < 0.05), between obtained values from ARNM, such as volume and minimum section area. These correlations are present on obtained values before and after vasoconstrictor use, as in five or two and three centimeters analysis.
When comparison between results by ARNM and clinical standards is done, datum analysis shows an important correlation, statistically expressive (p < 0.05) and inversely proportional from ARNM rates (volume and minimum section area) with clinical rate. However, such correlation appeared only on the analysis done before vasoconstrictor use, and not afterwards.
It is important to say, still in relation to ARNM, that these correlations were obtained when analysis was done from the outside of nostrils to five centimeters inwards. Clinical rate and volume and minimum section area correlation got lost (p = ns) on both analysis with two and three centimeters nasal cavity inward.
In relation to the obtained results by NPF, it was not observed any relation statistically expressive with the clinical one showed by the patient, as for oedema and congestion. The only correlation statistically expressive (p < 0.05) observed for NPF was achieved when compared its results to ARNM. There was a proportional relation between volume observed by ARNM and flow by NPF. This relation was only a coincidence and not study target.
DISCUSSIONResults achieved in this pilot study imply that ARNM is a reliable method to evaluate nasal cavities, due to a good correlation of volume and minimum section area of nasal cavity in patients with rhinitis signs and symptoms. However, reliability of this method was only demonstrated before the use of topical vasoconstrictor, losing its competence after medication. In other words, clinical improvement after vasoconstrictor use was better than the one showed by ARNM. There are four assumptions, probably working together, which can explain all this:
1. The first one is improvement subjectivity. The worse the symptoms, the bigger the sensation to a specific improvement. Human sensibility is not stable, what makes that those small improvements, to objective analysis exams, are understood as important ones to patient, especially on severe congestion cases. This explains a disproportional quantity of zero or one score to congestions observed after vasoconstrictor use.
2. The second one says that graduation scale tables of signs and symptoms are not sensitive enough to keep a correlation with ARNM. So, when a sign or symptom obtains one point less after vasoconstrictor use (what means 25% improvement), the detected improvement by ARNM (real one) might not be so intense.
3. The third is based on a possible correlation of clinical improvement with values not researched in this study, as for example, airflow resistance.
4. The fourth one, which explains lack of correlation between ARNM data and clinical standards, is bias in the exam: relation between congestion values and oedema achieved in the study suggest that the physical exam result of each patient can be biased, what means, physical exam improvement depends on symptom improvement. Thus, if the examiner applies physical exam after questioning patients on their symptomatic improvement, he/she would tend to overestimate it on the physical exam. We believe this is not a reason to disqualify the work as a whole, because in our exercise, we have as first focus the symptom improvement of patients, what is better seen by obstruction improvement than oedema one.
In relation to absence of ARNM correlation with clinical standards when evaluating two or three centimeters nostril inwards, we explain that: nasal obstruction sensation results basically in two factors, volume (inversely proportional) and resistance (directly proportional) that appear especially on the nasal valve. So, when more posterior regions on the nasal cavity are not analyzed, as on the two and three centimeters cases, we are not only withdrawing large part of the volume, but also valuing resistance, which is placed before. Thus, correlation with clinical standards becomes endangered.
There is an explanation to the lack of expressive correlation between NPF with clinical standard results, either before and after vasoconstrictor use: in despite of NPF being a cheap and simple method, which does not require specific training from the examiner, it is an exam that depends much on the patient. In this way, its results may vary a great deal as some patients neither understand the exam procedure technique nor are ready to cooperate with it.
As this is a pilot study, we encourage future studies which may verify reproductibility of our results.
CONCLUSIONThe results achieved from this study can lead to the following conclusions:
1. ARNM presented statistically expressive correlation with signs and symptoms before and after vasoconstrictor use when analyzed five centimeters nostrils inward.
2. There was no statistically expressive correlation between ARNM and signs and symptoms when analyzed two or three centimeters nasal cavity inward.
3. There was no ARNM correlation with signs and symptoms before vasoconstrictor use.
4. There was no NPF correlation with signs and symptoms either before or after vasoconstrictor use.
BIBLIOGRAPHY1. Castro, FFM, Rinite Alérgica: modernas abordagens para uma clássica questão. 1a ed, São Paulo, Lemos Editorial, 1997.
2. Passali D, Mezzendimi C, Passali C. G, Bellussi L. Monitoring methods of nasal pathology. Int J Ped Otorhinolaryngol, 49 suppl 1 (1999) S199-S202.
3. L. Malm, R. Gerth van Wijk, C.Bachert, Guidelines for nasal provocations with aspects on nasal patency, airflow, and airflow resistance. Rhinology, 2000; 38, 1-6.
4. Fonseca M T, Maia F, Goto E, Nigro C E, Mello-Júnior J, Voegels R L, Reprodutibilidade e repetibilidade da rinometria acústica: nossa experiência. Arquivos de Otorrinolaringologia, 2003, 7(3): 213-18.
5. Fairley J. W, Durham L. H, Ell S. R. (1993) Correlation of subjetive sensation of nasal patency with nasal peak flow rate. Clin Otolaringol, 18, 19-22.
6. Cakmak O, Celik H, Ergin T, Sennaroglu L. Accuracy of acoustic rhinometry measurements. Laryngoscope, 2001; 111: 587-594.
7. Corey J, Kemker B, Nelson R, Gungor A. Evaluation of the nasal cavity by acoustic rhinometry in normal and allergic subjects. Otolaryngol Head Neck Surg, 1997; 117: 22-8.
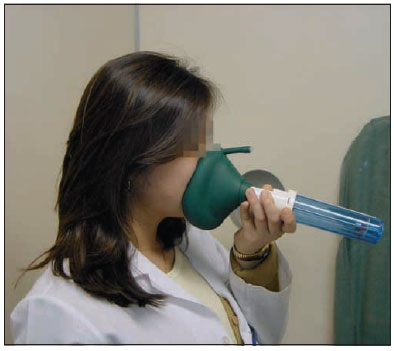
Picture 1. Patient and device placing for nasal inspiratory peak-flow.
Graph 1. Signs X Symptoms - left nostril, pre-vasoconstrictor. N = 32 ; p < 0.05
Graph 2. Signs X Symptoms - left nostril, post-vasoconstrictor. N = 32; p< 0.05
Graph 3. Clinical Rate x PFNI - pre-vasoconstrictor. N = 32; p = ns
Graph 4: Clinical Rate x PFNI - post-vasoconstrictor = 32; p = ns
Graph 5. Clinical Rate x Volume - up to 5cm, left nostril, pre-vasoconstrictor. N = 32 p < 0.05.
Graph 6. Clinical Rate x Volume - up to 5cm, left nostril, post-vasoconstrictor. N = 32; p < 0.05.
Graph 7. Clinical Rate x Minimum Section Area - up to 5cm, left nostril, pre-vasoconstrictor. N = 32; p< 0.05.
Graph 8. Clinical Rate x Minimum Section Area - up to 5cm, left nostril, post-vasoconstrictor; n = 32; p < 0.05.